One sensing engine. Three sides.
Signals enter on the left (offline · online · external). The Experience Sensing Engine runs four stages — Readiness Measurement, Journey Capture, Behavioural Analytics, AI Inference — and emits four core KPIs. Playbooks on the right route each KPI to the team that can act. Operational changes feed new signals back to the engine for continuous learning.
Three signal families.
- · Offline store · RFQM · AOV · footfall · queue · path · putback · switching
- · Online / digital · RFQM · AOV · micro-journeys · NLP sentiment · channel switching
- · External / market · competitor pricing · local promotions · environment · seasonality
Four stages, in order.
- · Readiness Measurement · store readiness · digital readiness · external context
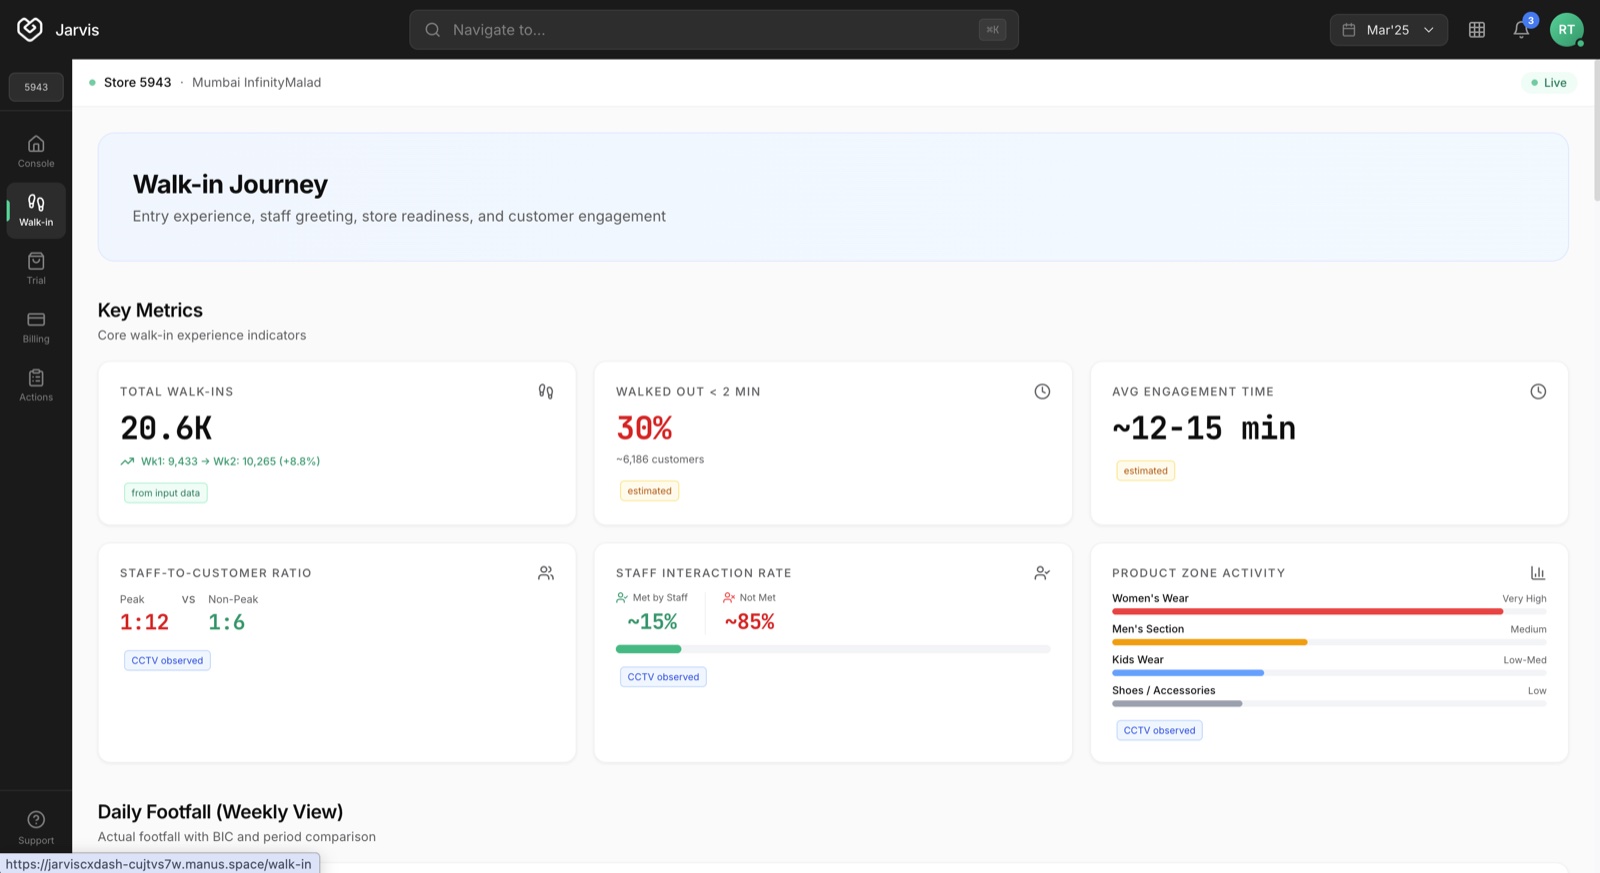
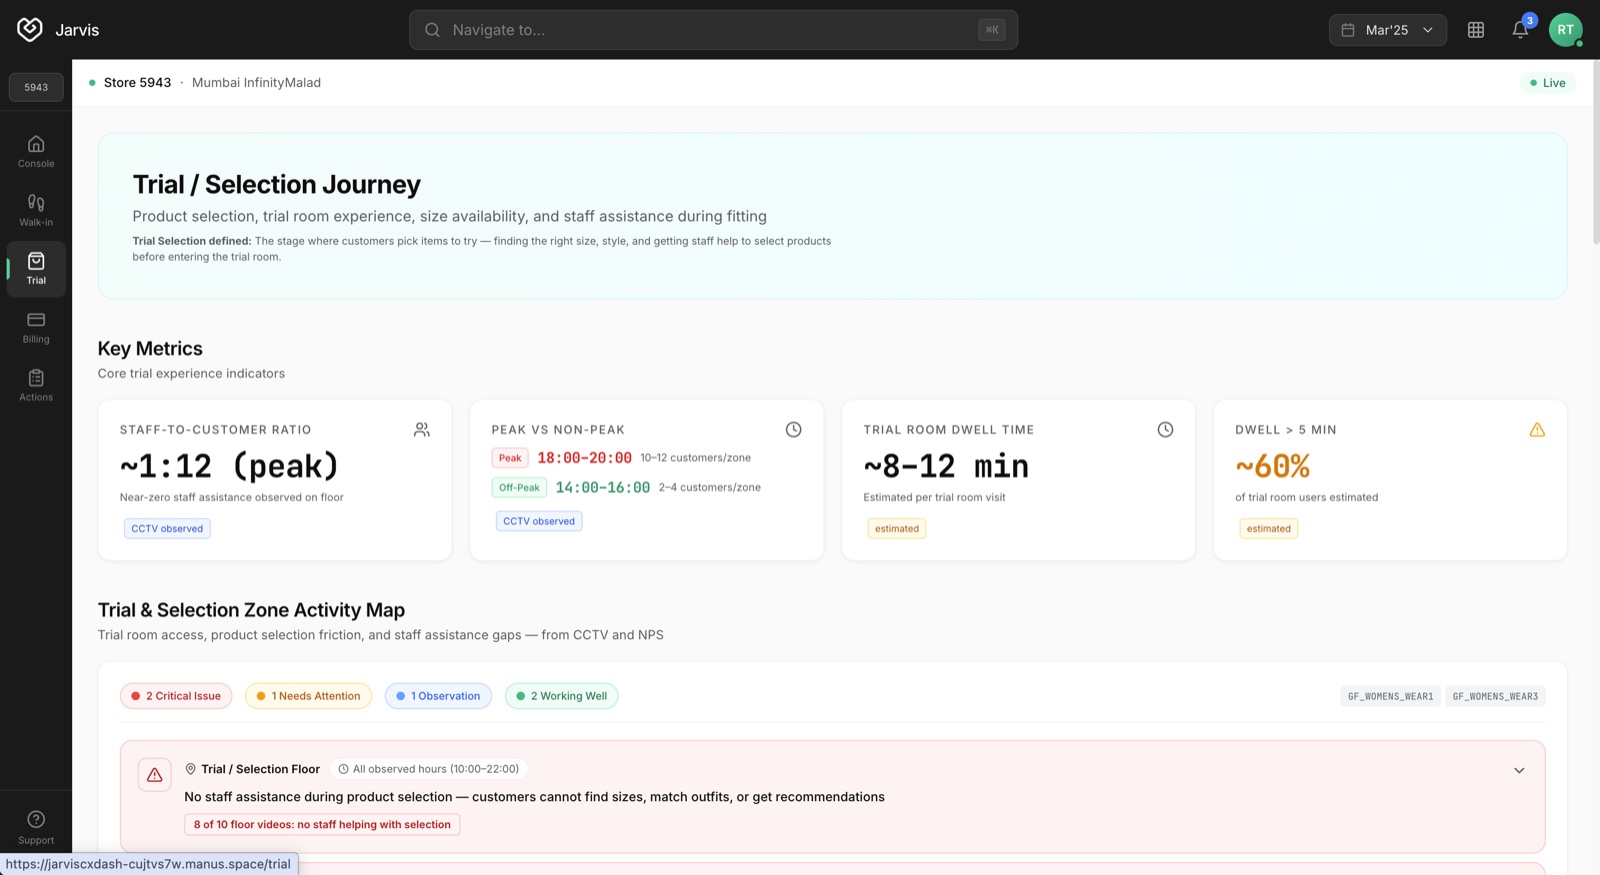
- · Journey Capture · offline · digital · fulfilment
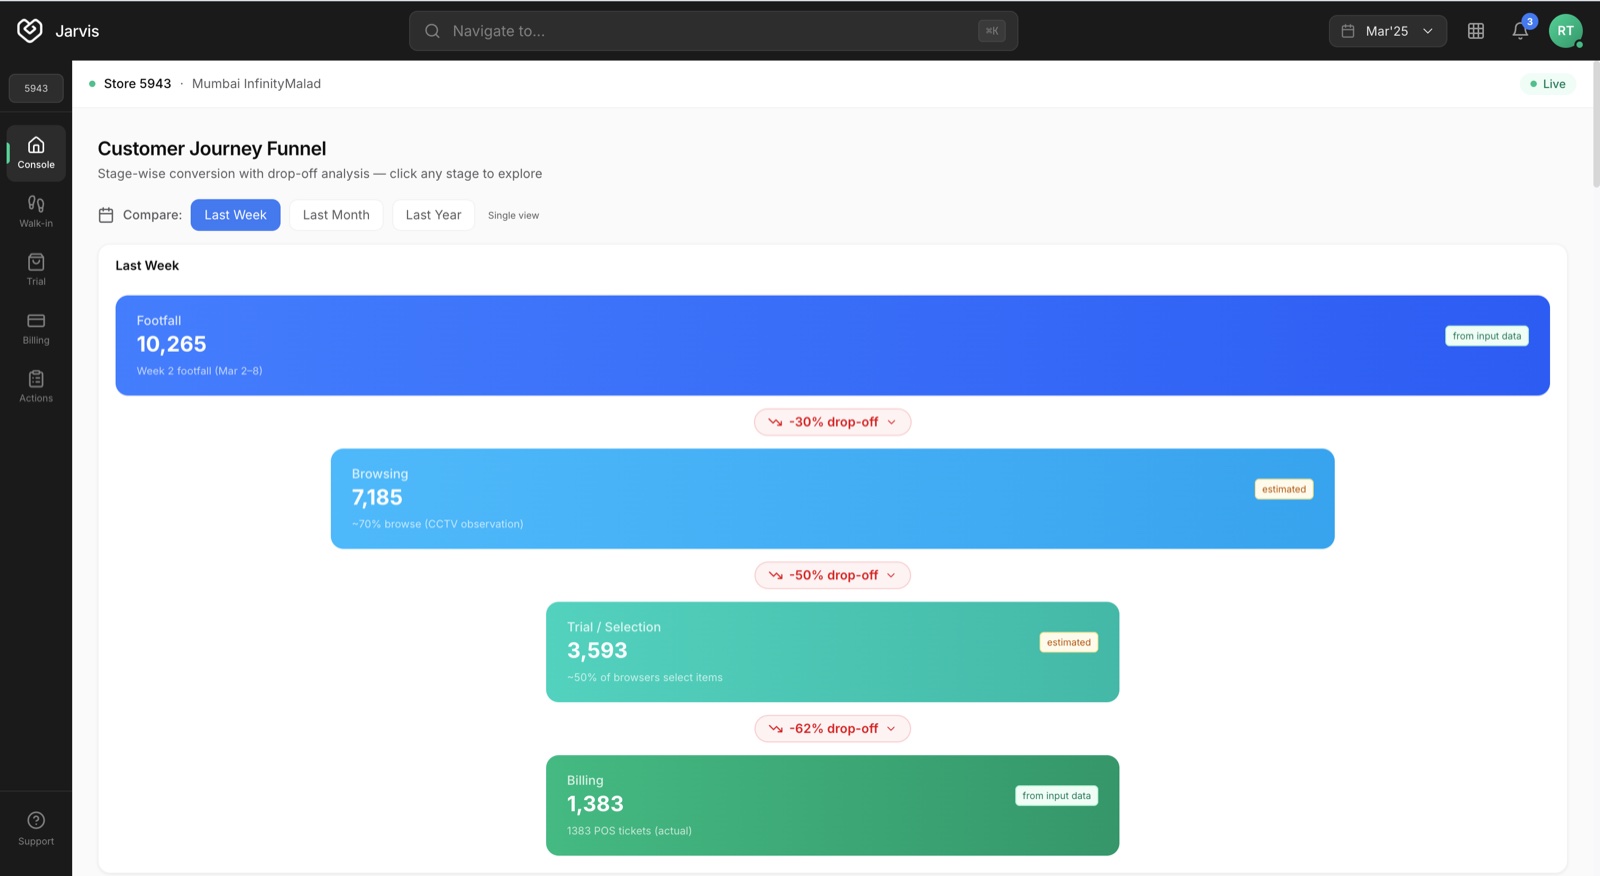
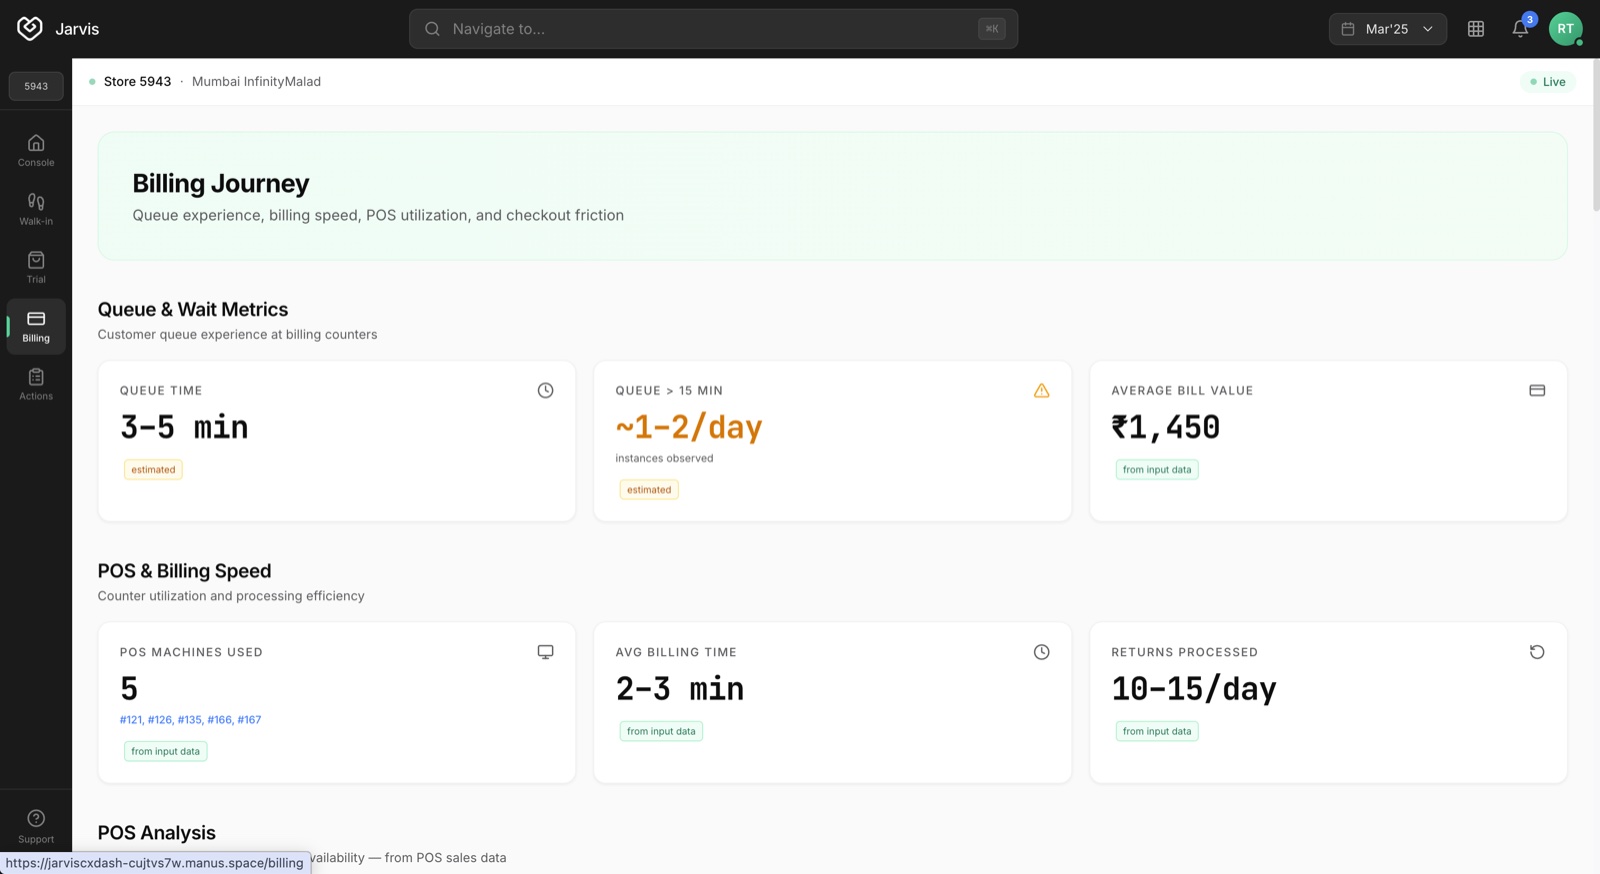
- · Behavioural Analytics · dwell · paths · queue · funnel
- · AI Inference · experience quality · friction locations · churn risk
Four owners, by KPI.
- · Store Operations · readiness · staffing · assortment
- · Digital & Product · search · performance · payments
- · Fulfilment & Logistics · SLA · substitutions · reliability
- · CRM & Marketing · retention · outreach · recovery
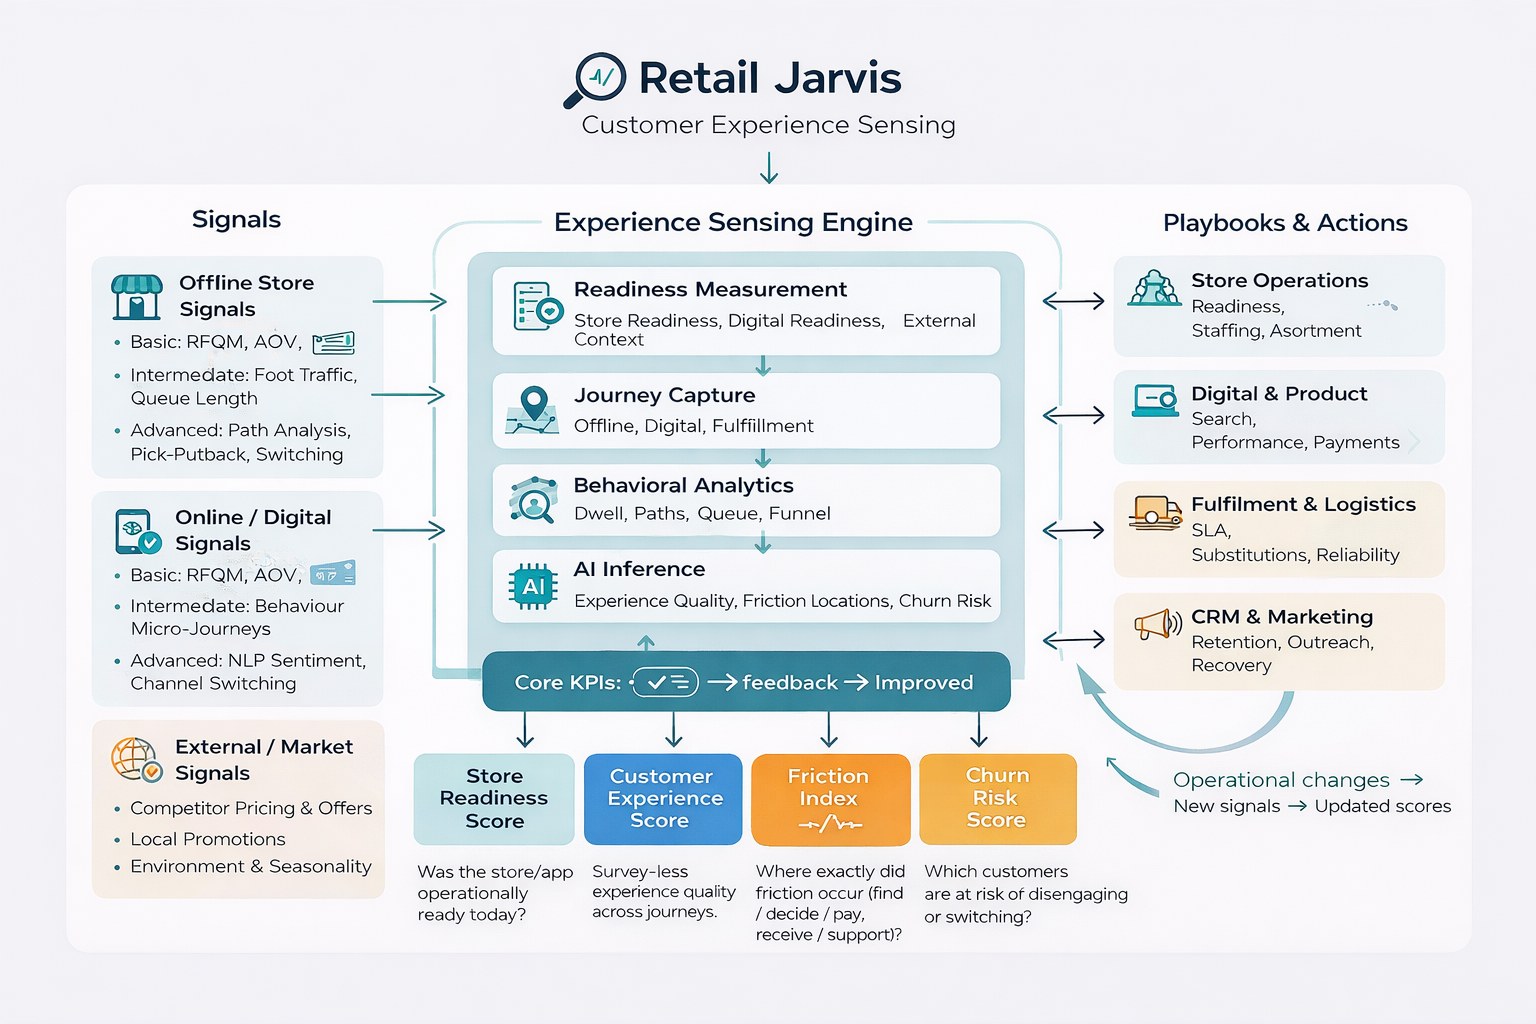
Signals (Offline Store · Online / Digital · External / Market) → Experience Sensing Engine (Readiness Measurement · Journey Capture · Behavioural Analytics · AI Inference) → Core KPIs (Store Readiness · Customer Experience · Friction Index · Churn Risk) → Playbooks (Store Ops · Digital & Product · Fulfilment & Logistics · CRM & Marketing). Operational changes feed new signals back · scores update.